At the beginning of this module I said that other statistical methods in this subject, like t-tests and ANOVA,
are actually just special versions of regression—in other words, anything you do with a t-test could
also be done with regression. (A t-test is essentially just a shortcut to doing one specific kind of
regression.)
Explain why this is the case.
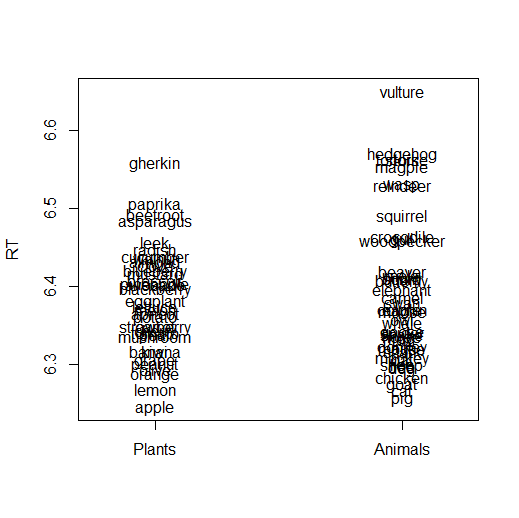
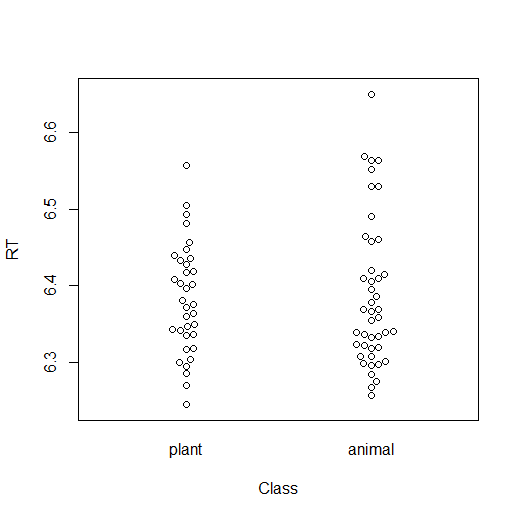
So far we have only examined how to deal with categorical variables with two levels (e.g., plant vs. animal). Sometimes
you might have more levels than that; for example, maybe you do a study comparing English speakers, Mandarin
speakers, and Cantonese speakers. (Categorical variables with more than two levels are sometimes called "polytomous".)
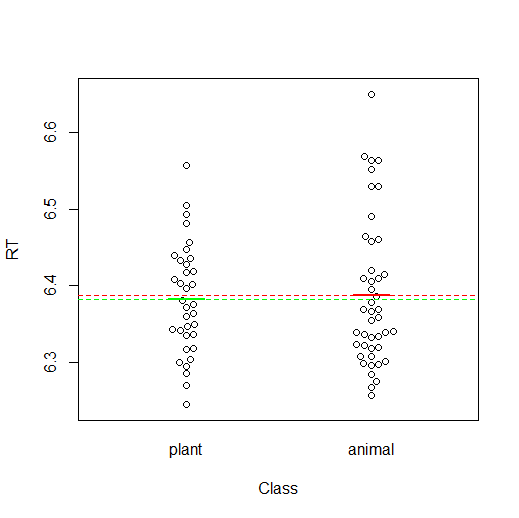
Remember that when we do dummy coding, we turn the categorical variable into a comparison between two levels: the
baseline level (plant words, in our example) and another level (animal words, in our example).
To handle a variable with more levels, we need to make more comparisons. Think about the English-Cantonese-Mandarin
example I just mentioned. In such a variable, there are three possible comparisons:
- English vs. Cantonese
- English vs. Mandarin
- Mandarin vs. Cantonese
In reality, we only need to make two of these comparisons to fully describe all three conditions. (If I know that
English speakers' score on some task is 50, and I know that Cantonese speakers are 15 points higher than English
speakers, and I know that Mandarin speakers are 10 points higher than English speakers, then I don't need to
specifically calculate the Mandarin vs. Cantonese difference; I can take the information I already mentioned above
and use basic arithmetic to deduce that Cantonese is 5 points higher than Mandarin.)
Thus, for any categorical variable with K levels, we can represent it in regression as K-1
comparisons.
Sticking with dummy coding for now, we can transform our "language" variable (a categorical variable with three levels)
into two numeric variables: one variable comparing English vs. Cantonese, and another variable comparing English vs.
Mandarin. (The choice of which comparison to leave out will be based on your research question; if comparing Mandarin
vs. Cantonese is important to your research, you can keep the Mandarin vs. Cantonese comparison and leave out one of
the others.) Each data point will get two numbers (one for each variable), as follows:
- For the English vs. Cantonese comparison: Cantonese speakers will get 1, and everyone else will get 0;
- For the English vs. Mandarin comparison: Mandarin speakers will get 1, and everyone else will get 0.
Thus, after we assign the numbers to each data point, there will be the following combinations:
| |
Eng-vs-Can variable |
Eng-vs-Man variable |
| English speakers |
0 |
0 |
| Cantonese speakers |
1 |
0 |
| Mandarin speakers |
0 |
1 |
When we do a regression, English speakers will have a value of 0 for each variable; in other words, English is the
baseline level, and thus the predicted score for English speakers will just be the intercept.
Cantonese speakers, on the other hand, will have a value of 1 for Eng-vs-Can, and a value of 0 for Eng-vs-Man. Thus,
their predicted score will be the intercept plus the Eng-vs-Can coefficient. In other words, the Eng-vs-Can
coefficient in the regression results will tell us how much higher Cantonese speakers' score is than English
speakers' score.
Finally, the coefficient for Eng-vs-Man will tell us the difference between English and Mandarin speakers, following
the same logic.
There will be no coefficient showing the difference between Mandarin and Cantonese; as described above, this can
already be inferred from the other coefficients. If you want to see the comparison between these directly, then you
should choose one of these groups (Mandarin or Cantonese), rather than English, to be the baseline group when you
code the variables.
You may have noticed here that there are a lot of possible comparisons that have not been covered; for example, we
haven't looked at how to compare English vs. the average of Mandarin and Cantonese. When you do the reflection
question below you will probably come up with more. This is intentional; we have only discussed
dummy coding, and many
other coding schemes exist. For some kinds of comparisons, other coding schemes would be more appropriate. This
is a topic you could spend a very long time studying; but first, you need to at least understand dummy coding.
Think of a situation in your research where you might have a variable with four or more levels.
Describe which level should be the baseline, and which comparisons you want to make. Make a table like the above one
to show what the coefficients would be.