One thing that's useful about confidence intervals is that they can show more situations than p-values. A p-value can tell you if your effect is significantly different from some hypothesis (usually the hypothesis that "there is no effect") or if it's not. But a confidence interval, combined with some other common-sense information, can tell you more.
To understand how this works, we need to understand one other concept: the smallest effect of interest or smallest meaningful effect. In many research situations, we have some idea about what effect sizes we might be interested in. For example, if we are trying to develop some kind of training to improve kids' vocabulary, then we might have some idea of how effective this training needs to be to be worthwhile. If I do research and find that my training can improve kids' vocabulary by 2 words per year, but the training costs a billion dollars and involves spanking kids until they cry, then I should probably decide the training is not worthwhile—a vocabulary improvement of 2 words per year is simply not big enough to care about (especially if it comes with a substantial cost). In more basic science applications, the smallest effect of interest might not be motivated by practical or money or ethical concerns like the, above example but by what we know about the phenomenon we are studying. For example, if we do a reaction time experiment, we might know that cognitively meaningful effects (like priming) tend to increase or decrease reaction times by about 10 milliseconds or more, so we might assume that effects smaller than that are probably not meaningful. Or, for speech perception experiments, we might know that very subtle differences are not possible to perceive, so we might have some idea of how "big" a difference needs to be for it to be meaningful for speech perception research. Or we might know what kinds of differences are detectable by the methods currently available to us—for example, in event-related potential research (see the "Electrophysiology" module), linguistic manipulations tend to modulate brain components like the N400 or MMN by about 1-10 microvolts; so we know that an effect of 0.0001 microvolts is simply too small to meaningfully study using the equipment and the research paradigms that are currently available to us (it would instead require more sensitive technology and/or more sensitive research paradigms; we'll learn about the latter in the "Power" section of this module).
Why is this useful? Because when we calculate a confidence interval, we can see if that confidence interval does or does not exclude the smallest effect of interest. To see how, consider the example graphs below.
In each graph, I'm showing an effect (the red dot) and its confidence interval (the range of the red bars around the dot). In each graph, the dashed line shows the smallest effect size of interest in the study, and the solid black line shows zero effect.
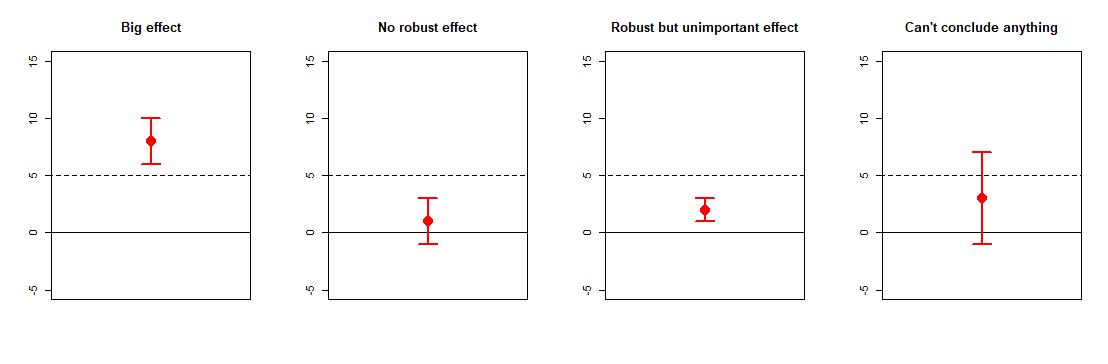
These are four common situations that can happen with research results, and which you can only see if you look at confidence intervals and think about the smallest effect of interest. The first two situations are generally situations that you like to get (they allow you to make clear conclusions), and the second two situations are generally situations you don't like to see (they don't allow any clear conclusions).
The first graph shows a situation where both zero and the smallest effect of interest are lower than the confidence interval. This is the sort of situation that allows you to conclude you found a big effect: you know your effect is significantly larger than zero, and you know your effect is significantly larger than any other effect that would be too small to care about. In other words, you've got a meaningfully large effect.
The second graph shows a situation where zero is within the confidence interval, and the smallest effect of interest is bigger than the confidence interval. This is the sort of situation that allows you to conclude you found no significant, meaningful effect: not only is your effect not-significantly-different-than zero, it's also significantly smaller than any effects that would be big enough to be meaningful. You really should never say you have "no effect" if you have not looked at this sort of confidence interval. (You will see why when we look at the last graph.)
The third graph shows a problem situation. Here, the effect is significantly bigger than zero, but it's also significantly smaller than any effect that would be big enough for us to consider meaningful. It's difficult to make a firm conclusion here. This paper has an example of an effect like this; we observed (in some of the exploratory analyses towards the end) an effect that may be significantly bigger than zero, but that is still so small it's arguably not very meaningful. This paper ended up causing some controversy in its field, because different people took it as evidence for different things; some people looked at this paper and felt that it supported the existence of this particular effect (because it did indeed find an effect significantly larger than zero), whereas others felt that it challenged the existence of this effect (because the effect found in this paper was significantly smaller than what any previous papers had found).
Finally, the last graph shows the worst (and, probably, most common) situation. The effect is not significantly different from zero, so you might be tempted to conclude "there's no effect". (Technically you should never say this; there's always an effect, it's just a matter of whether the effect is significant or not.) But the effect is also not significantly smaller than some meaningfully big and important effect sizes, like 6 or 7, since those are also within its confidence interval. In other words, you can't conclude anything from these results: they're consistent with "no effect" and also consistent with "big effect" at the same time. They are what we would call "uninformative" or "indeterminate" results; some people might even call them useless.
There are other possible patterns beyond the four shown here, but these four are common ones.
Thinking about your own research, why do you think it's important to look at this? What does this tell you that p-values don't? And can you think of what a "smallest effect of interest" might be for one of your projects?